01The problem
Checkout conversion is the number everyone in Purchase watches, but across four brands, multiple regions, web and app, and every payment method, there are far too many lines to eyeball. A dip in one brand's app conversion in one country can sit unnoticed in an aggregate that looks perfectly healthy.
I wanted two things: one place to see the whole checkout funnel, sliced any way we needed, and a system that tells us when something is actually wrong, without crying wolf every weekend.
02Discovery
Before building anything, I mapped the tables across URBN's data ecosystem that held the pieces of the funnel: sessions, cart visits, checkout starts, orders and demand, and the dimensions we'd want to cut them by.
- Volume measures: sessions, cart visits, began checkout, sessions with purchase, orders, demand
- Dimensions: region, brand, site, data source, channel grouping, device category, browser
- Grain: daily, so the same tables could power both trend lines and day-level anomaly checks
Getting this right up front meant the dashboard and the alerting could share a single source of truth instead of each reinventing the definitions.
03Building v1
- Snowflake aggregates. Built tables and views on top of the source data, mostly pre-aggregated, so the dashboard reads small, fast tables instead of raw event data.
- Scheduled refresh. Set up Snowflake tasks to rebuild those tables every day, with no manual pulls.
- Qlik dashboard. Imported the tables into Qlik, which reloads every day at 10 AM so the team starts the day with yesterday's numbers.
- Threshold alerts. Configured alerts that posted to Slack whenever a metric moved outside its set range.
04The dashboard
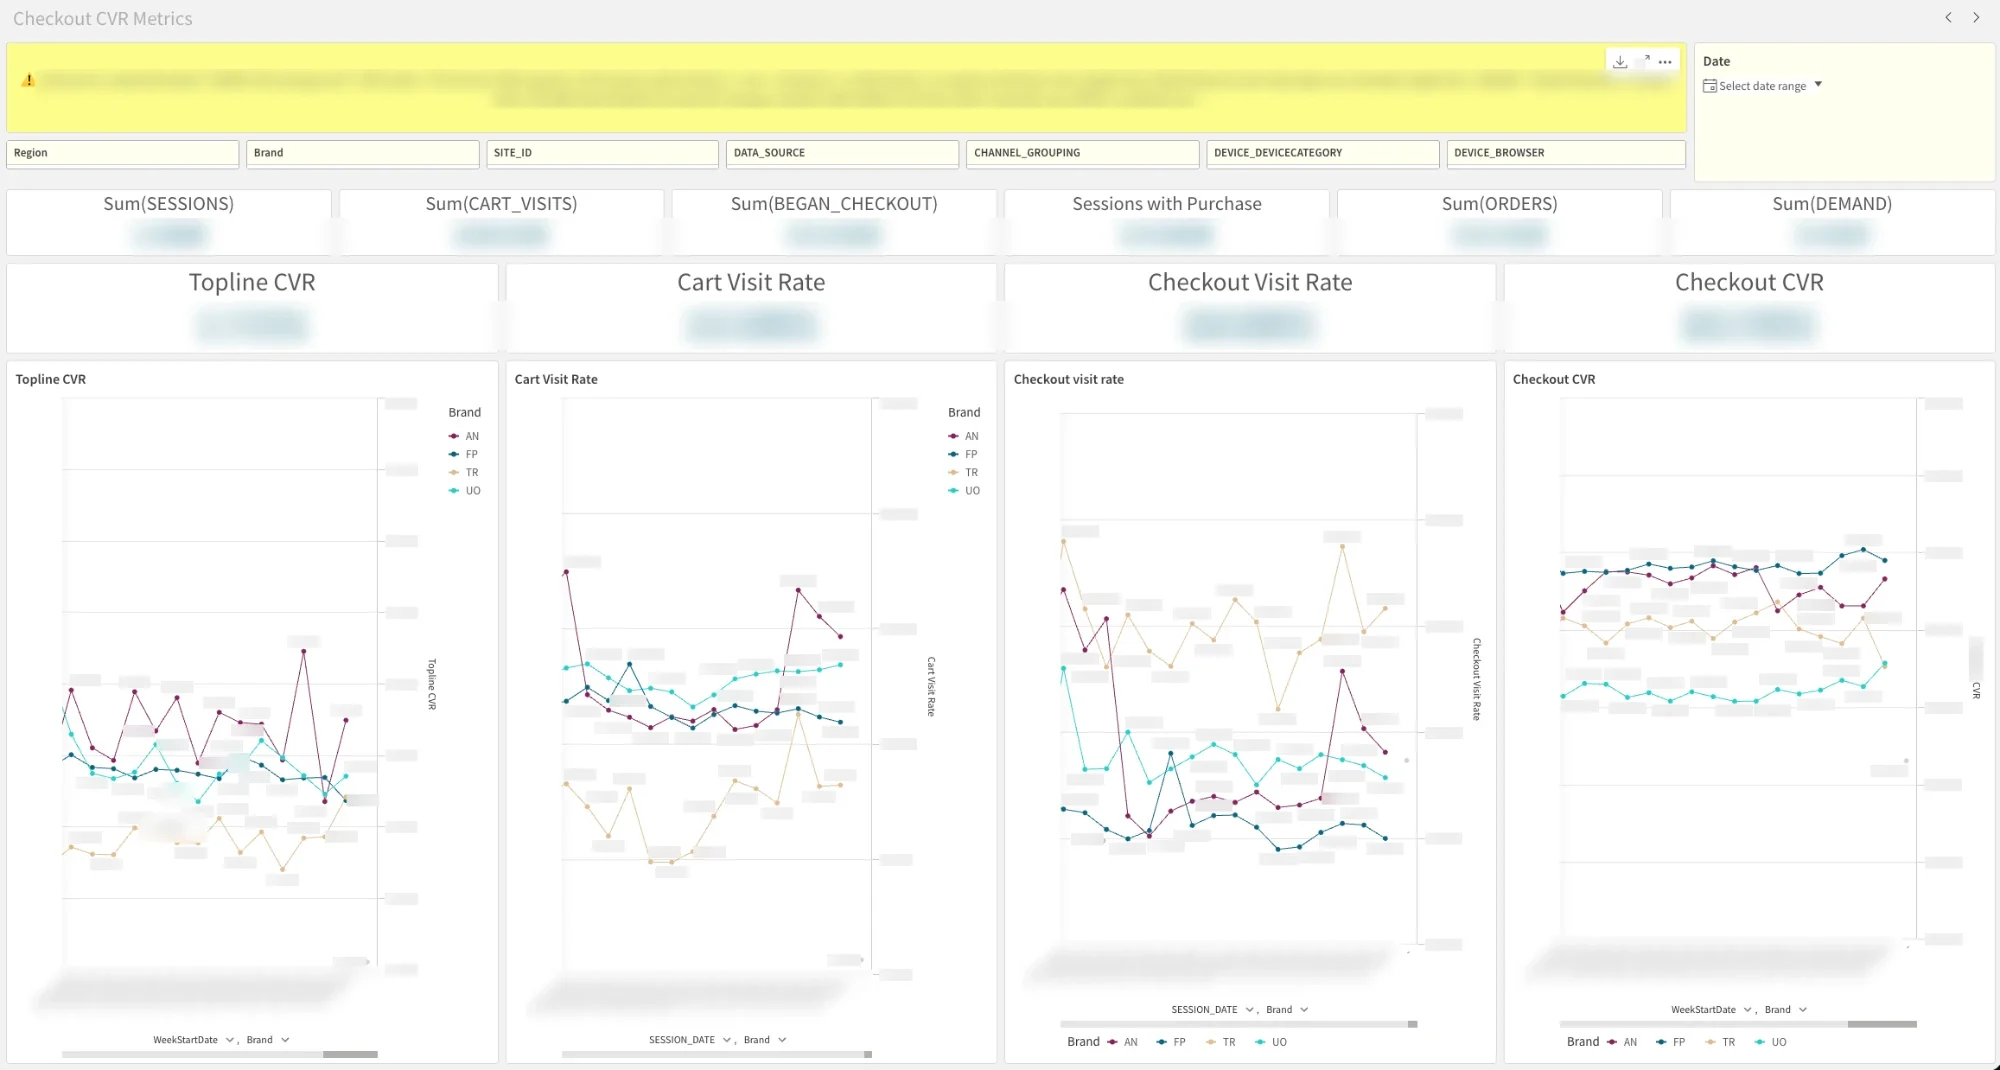
The Qlik dashboard puts the whole funnel on one screen: raw volumes across the top, four headline rates beneath them, and each rate trended by brand, with filters for every dimension from discovery.
Sessions that end in a purchase. The headline number.
How many sessions make it to the cart.
How many sessions begin checkout.
How many checkouts become orders.
Splitting topline conversion into its funnel steps is what makes a dip actionable. "CVR is down" starts a hunt; "checkout CVR is down on UO Canada app" points at a team.
05Outgrowing static alerts
The dashboard worked. The alerting didn't scale. Every combination of brand, region, platform and payment method is its own slice, and v1 hit three walls:
Qlik caps alerts per user, nowhere near enough to cover every slice worth watching.
A fixed range can't tell a weekend dip or a promo spike from a real problem.
Deeper checks meant running scripts by hand from a terminal.
06Rebuilding alerting with Data Science
I partnered with our Data Science team to rebuild alerting as a statistical pipeline. I brought the v1 data foundation, the metric definitions, and the domain context, like how web data supports deep segmentation while app data is more aggregated. Data Science led the statistical methodology and automation.
Instead of one threshold per slice, the new system evaluates five bounds methods for every combination of slice, metric and day, and only alerts on consensus: the STL method plus at least one other must agree. If only one method flags a day, the alert is suppressed.
| Method | Type | Notes |
|---|---|---|
| M1 · Rolling 28d ±2σ | Static σ | My original v1 approach. Simple and interpretable, but doesn't model day-of-week or trend. |
| M2 · DOW-aware | Same-day-of-week comparison | Compares each day to its last four same-weekday values. Reduces weekday/weekend bias, but bounds get noisy at small samples. |
| M3 · EWMA | Exponentially weighted | Reacts to recent shifts, but can absorb a persistent dip into the new baseline within about two weeks. |
| M4 · STL residual | Trend + weekly seasonality | Primary for high-volume slices (T1/T2). Decomposes the series and places bounds on the residual, not the raw value, so weekend lifts don't fire as anomalies. |
| M5 · Beta CI | Bayesian, volume-aware | Best for sparse slices (T3/T4). Treats attempts as Bernoulli trials, so intervals widen automatically at low volume. At high volume it over-fires, so it's a sensitivity check rather than a primary source. |
Why run all five?
Each method fails in a different way. Static bounds ignore seasonality, same-weekday comparisons get noisy, EWMA forgets, and Beta intervals are too strict at scale. Requiring agreement filters out each method's particular noise, while running them side by side shows when STL and a second method both catch a real signal that neither would be trusted on alone.
Rules on top of the statistics
- Volume tiers: high-volume slices lean on STL; the long tail of small markets and payment methods (T3/T4) uses volume-aware and rule-based checks, so a handful of orders can't trigger an alert
- Cluster-day suppression: when six or more slices fire on the same day, it's almost always a promotion or holiday, so those alerts are held back
- Cross-site outage detection: when three or more sites dip on the same payment method on the same day, it's flagged as a likely payment-provider incident rather than an internal bug
07The Slack digest & Purchase Monitor
The whole pipeline now runs on Claude. It's packaged as a Claude skill that an always-on scheduler runs every day with no manual steps: Claude pulls the data, runs the anomaly analysis, posts the digest to a dedicated Slack channel, and publishes an HTML dashboard. No more running scripts from a terminal. The team agreed to treat the Slack channel as the source of truth for checkout anomalies.
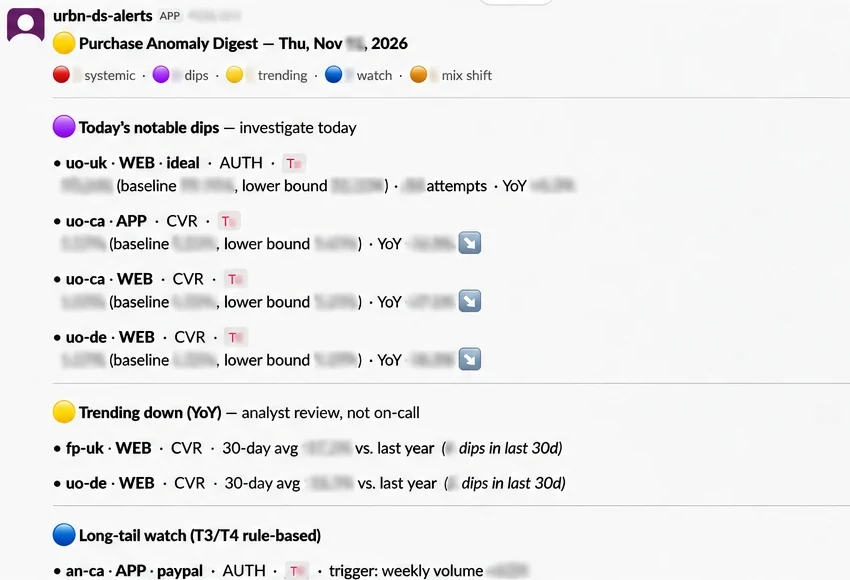
Each line carries what's needed to triage without opening anything else: brand and region, platform, metric, the observed value against its baseline and lower bound, and the year-over-year change. Items are grouped by urgency: notable dips to investigate today, slow year-over-year declines for analyst review, and a long-tail watch list.
The Purchase Monitor dashboard
For anyone who needs to dig deeper, the companion dashboard has four views:
The day's flagged dips with full context.
Every slice by week against the same week last year, so slow declines stand out.
Alerts the consensus and cluster rules held back, so the filtering can be checked rather than trusted blindly.
The five methods and consensus rule, documented next to the data.
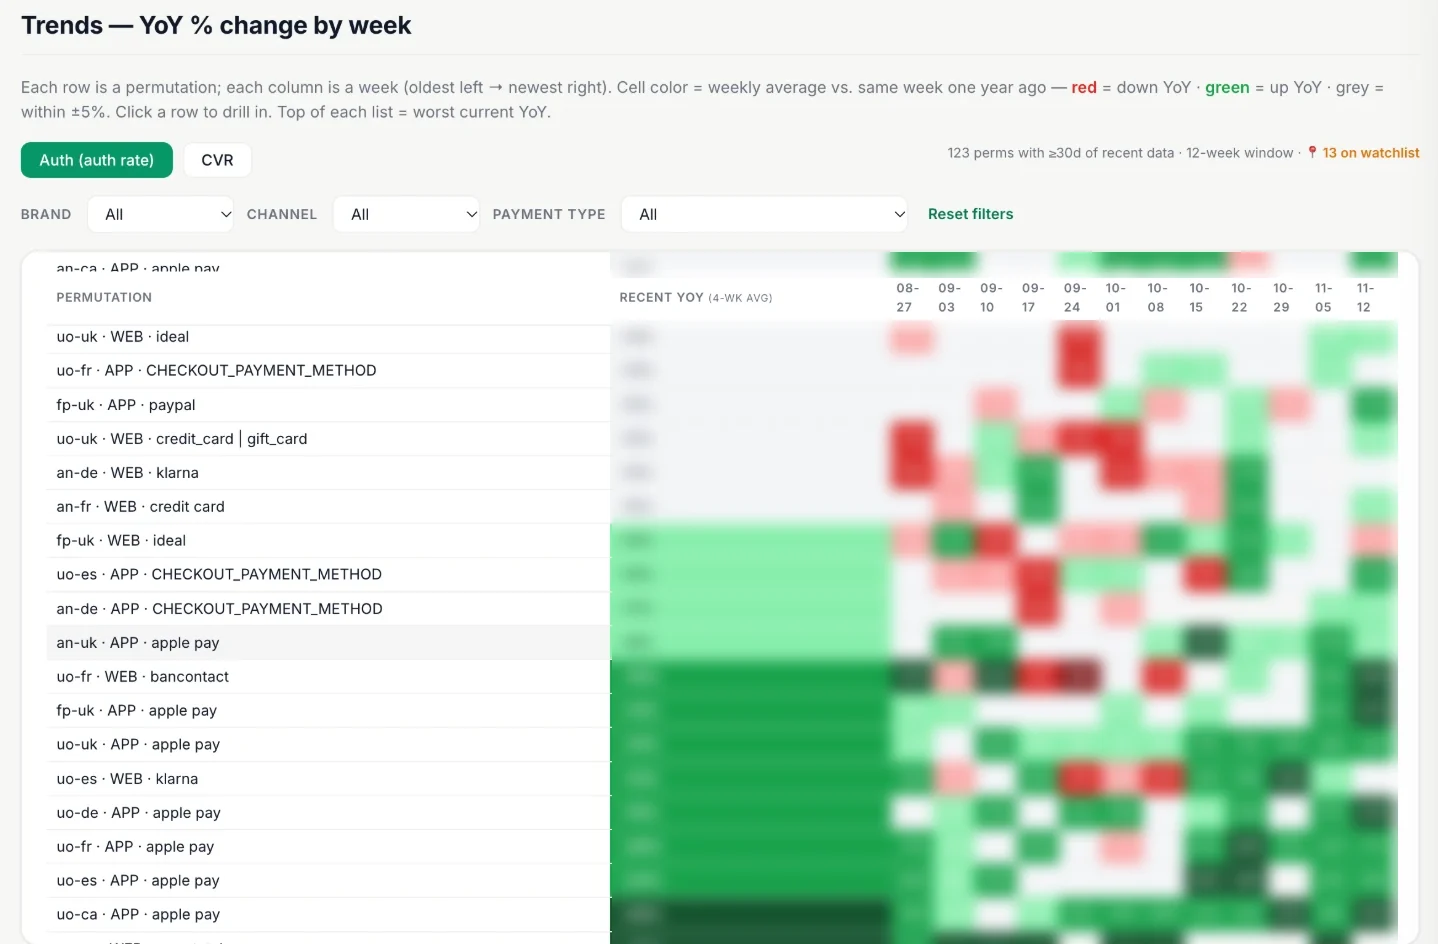
The dashboard is deliberately kept to a small group who know the baselines well. Reading hundreds of slices takes domain context, so the digest is for everyone and the dashboard is for investigation.
08What's next
- Running QA on the daily alerts and feeding results back to tune the system
- Extending the same pattern to other metrics, like session drops, starting with the KPIs that matter most in finance reviews
09Skills demonstrated
- Data discovery: mapped the funnel across URBN's data ecosystem before writing a pipeline
- Data engineering: Snowflake aggregate tables and scheduled tasks for daily refresh
- BI & visualization: a Qlik dashboard that breaks conversion into actionable funnel steps
- Knowing when to rebuild: recognized when static alerting hit its ceiling
- Cross-functional collaboration: partnered with Data Science on consensus-based anomaly detection
- AI-powered automation: the daily analysis runs as a scheduled Claude skill instead of scripts run by hand
- Operational adoption: made the Slack digest the team's source of truth, with a feedback loop to keep improving it